Heat Map MultiColor
Description:
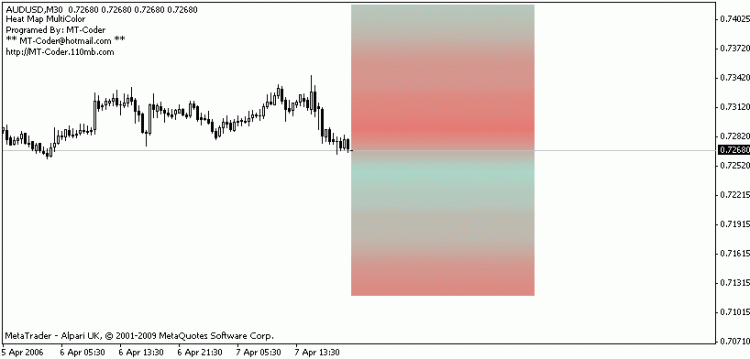
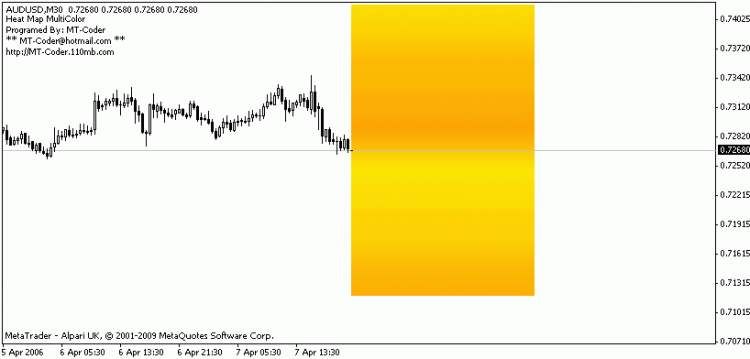
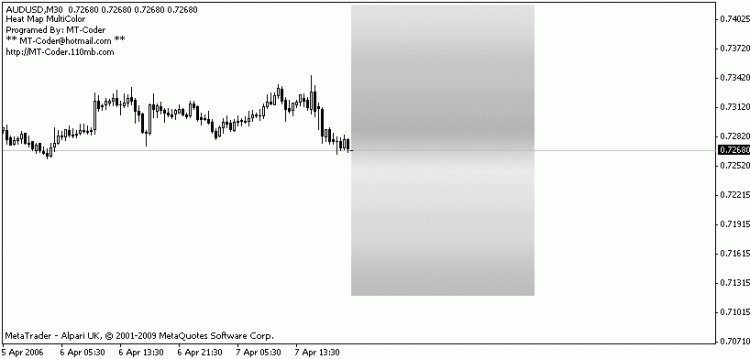
The purpose of this indicator is to highlight the price zones that had the most activity : the hottest zones.The indicator shows a gradient of colors from Cold to Hot.
Blue to Red
Yellow to OrangeRed
White to Grey.
** ** ** * ** * *** SETTINGS ** ** **** ** * **
- HMPeriod : the number of bars included in the count
- Scale : the size of each zone.
- NbZone : the number of zones to create.
- Cold : the color of the coldest zones.
- Hot : the color of the hottest zones.


No comments:
Post a Comment